Preface
Understanding GC theory and collection algorithms is only the beginning. The harder part is connecting those ideas to the collectors that actually run in production JVMs. The first language with dynamic memory allocation and garbage collection was not Java but Lisp back in 1960, but the focus here is not Lisp. The goal is to walk through the classic HotSpot collectors, look at what each one is trying to optimize, where it shines, where it struggles, and why collectors like CMS and G1 became such important milestones.
As collector efficiency improved, implementation complexity rose with it. That is especially true for CMS and G1, which are worth studying in detail because they reveal how JVM garbage collection evolved from simple stop-the-world designs to systems that try to balance latency, throughput, memory layout, and predictability.
What “classic” collectors means here
“Classic” is just a scope boundary. The discussion covers the garbage collectors available in the HotSpot VM shipped with Oracle JDK after JDK 7 Update 4—when G1 became officially production-ready—and before JDK 11. That gives us the familiar generation-era collectors that were heavily used in real production systems and remained important for years.
They are not the newest ideas anymore, especially compared with newer low-latency collectors, but they are mature, battle-tested, and still foundational for understanding JVM GC behavior.
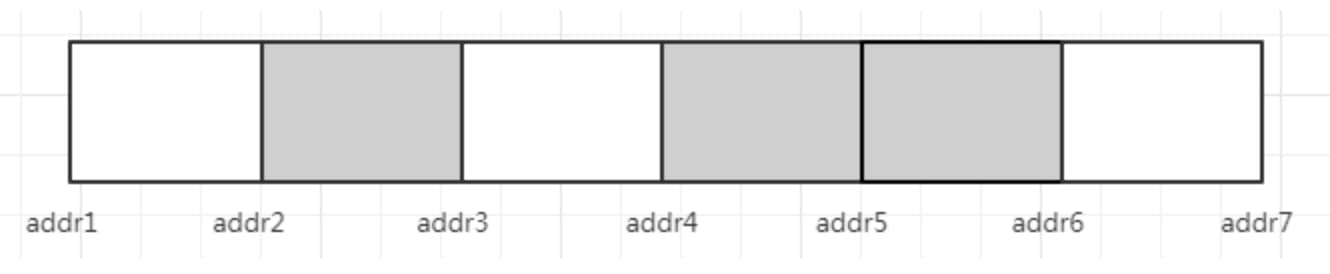
The traditional HotSpot collector landscape looked like this:
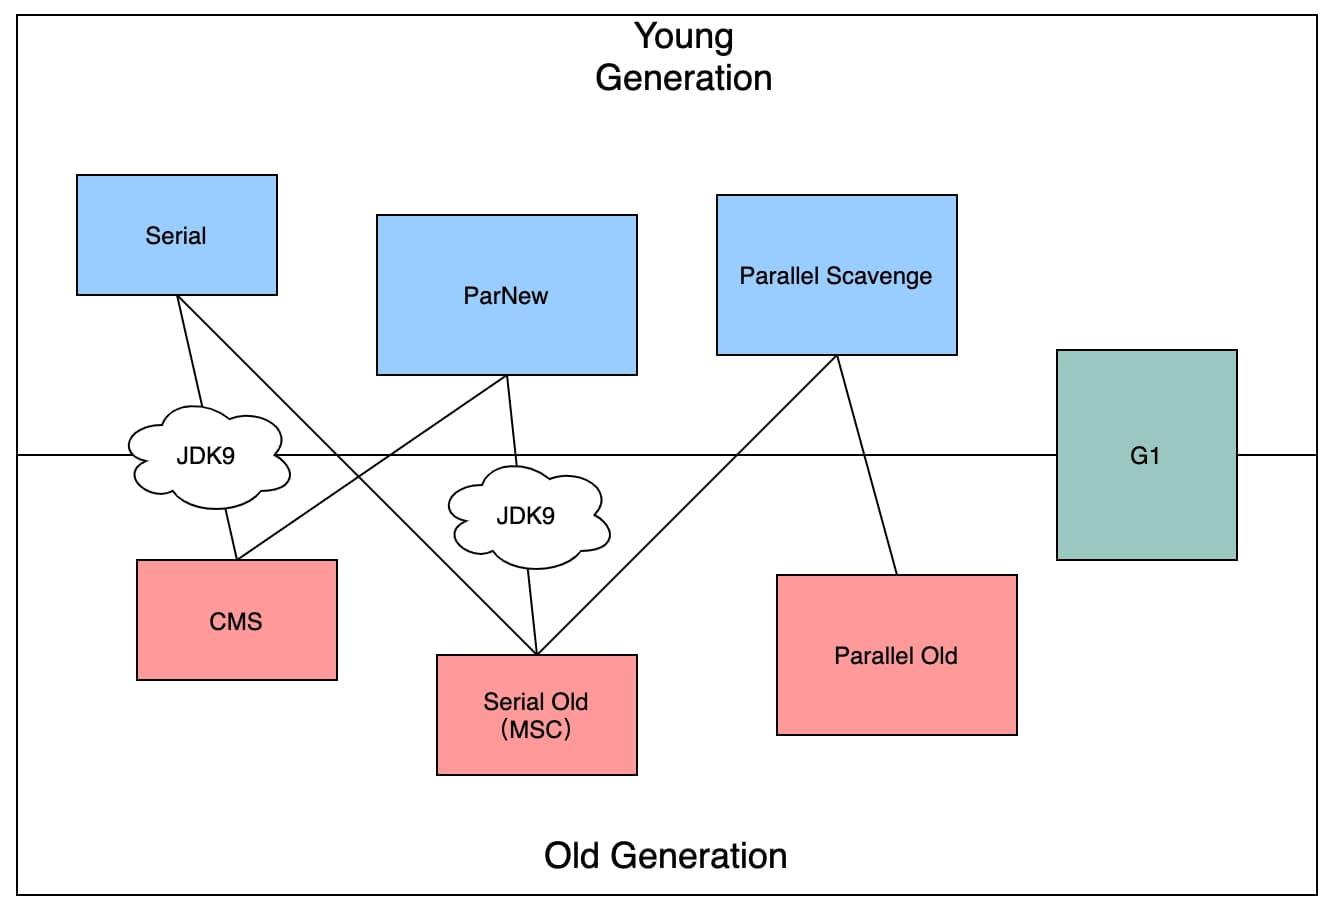
The diagram shows seven collectors working across different generations. The upper row corresponds to the young generation, the lower row to the old generation. A connection between two collectors means they can be paired together.
One detail matters: these pairings were not permanent. Because maintenance and compatibility testing are costly, JDK 8 deprecated the Serial + CMS and ParNew + Serial Old combinations, and JDK 9 removed support for them entirely.
Before going further, one point should be clear: there is no universal JVM garbage collector that performs perfectly in every scenario. If such a collector existed, HotSpot would not have needed so many different collectors with overlapping lifetimes.
Serial collector: simple, old, and still useful
The Serial collector is the most basic and oldest HotSpot garbage collector. Before JDK 1.3.1, it was the only choice in HotSpot.
Its name says almost everything: it is a single-threaded collector. That does not only mean it uses one collection thread; it also means that when it performs garbage collection, it must pause all application threads—a classic stop-the-world, or STW, event.
In the young generation, Serial uses the mark-copy algorithm. In the old generation, Serial Old uses mark-sweep-compact. Both are single-threaded and both require STW.
That sounds outdated, but “single-threaded” does not mean “useless.” Serial survived because it still has clear advantages:
- the implementation is simple and reliable;
- it has the lowest memory overhead among these collectors;
- on single-core or low-core-count machines, avoiding context switching can actually make it efficient enough;
- in small heaps where GC does not happen frequently, its disadvantages may barely matter.
For small-memory environments, CPUs with few cores, and workloads that do not trigger GC often, Serial can still be a good fit. It also remained the default collector for HotSpot running in client mode.
Parallel collector: throughput first
The Parallel collector is often called the parallel collector because it performs garbage collection with multiple threads.
Parallel Scavenge handles the young generation and uses mark-copy. Parallel Old handles the old generation and uses mark-sweep-compact.
Like Serial, the Parallel family still triggers STW in both the young and old generations. The difference is that marking and collection work are performed in parallel, so pause time and total GC time are much shorter than Serial’s, and collection throughput improves significantly.
This collector family is designed primarily around throughput rather than minimizing pause time. That is an important distinction from CMS. CMS tries to reduce pauses; Parallel tries to make garbage collection efficient enough that the application gets more useful work done overall. It was also the default collector in JDK 8.

Parallel works especially well on multicore processors. During GC, multiple CPU cores participate in cleaning up garbage at the same time, which shortens pauses. Between GC cycles, no GC threads are running, so they consume no CPU resources.
Two parameters make Parallel Scavenge especially tunable for throughput goals:
-XX:MaxGCPauseMillis-XX:GCTimeRatio
-XX:MaxGCPauseMillis sets a desired upper bound on garbage collection pause time in milliseconds. The collector will try to stay within that target, but setting it too aggressively usually lowers throughput.
-XX:GCTimeRatio controls the ratio of GC time to total time. It accepts an integer greater than 0 and less than 100. If the value is N, then the ratio of application execution time to total execution time is N:N+1. For example:
—XX:GCTimeRatio=19
means garbage collection should occupy about 5%(1/(1+ 19)) of total time. The default is 99, which corresponds to roughly 1% of time spent in GC.
Parallel’s weakness is also obvious. It must still stop the world while collecting. Even though multiple GC threads work in parallel and collection itself is fast, its pauses are still longer than collectors explicitly designed for short STW events, such as CMS, G1, ZGC, or Shenandoah. And as heap size grows, Parallel’s cleanup work slows down.
A quick clarification:
- Parallelism means multiple processors or cores execute multiple tasks at the same time.
- Concurrency means a single processor or thread switches among tasks so they appear to run simultaneously.
CMS: the classic low-pause collector
CMS stands for Mostly Concurrent Mark and Sweep Garbage Collector.
In practice, CMS uses a parallel young-generation collector (ParNew) and a concurrent old-generation collector (CMS). The young generation still uses an STW mark-copy algorithm, while the old generation uses a concurrent mark-sweep approach.
ParNew is essentially a multithreaded version of Serial. Aside from using multiple GC threads, its behavior matches Serial in terms of control parameters, collection algorithm, STW behavior, allocation rules, and collection strategy. It became important largely because ParNew was the only collector other than Serial that could work with CMS.
The design goal of CMS was straightforward: avoid long pauses when collecting the old generation.
That goal matters because young-generation pauses are usually short anyway. Young-generation collection relies on copying, and the number of surviving objects is typically small, so mark and copy phases are fast. The old generation is different: more live objects, more expensive traversal, and in older algorithms, a substantial amount of time spent on compaction. That is where painful STW pauses came from.
CMS attacked the problem in two ways:
- it does not compact the old generation during normal collection, using a free list to manage reclaimed space instead;
- most of marking and cleanup work runs concurrently with application threads.
During concurrent marking, the application is not paused, but CMS and the application compete for CPU time. By default, CMS uses roughly (number of CPU cores + 3) / 4 concurrent GC threads.
If a server has multiple CPU cores and the main tuning goal is reducing latency caused by GC pauses, CMS is a sensible choice. It can improve user-facing responsiveness considerably. But when CPU resources are tight, CMS can hurt throughput noticeably. In many systems, the throughput and latency difference between CMS and Parallel is not dramatic enough to ignore resource constraints.
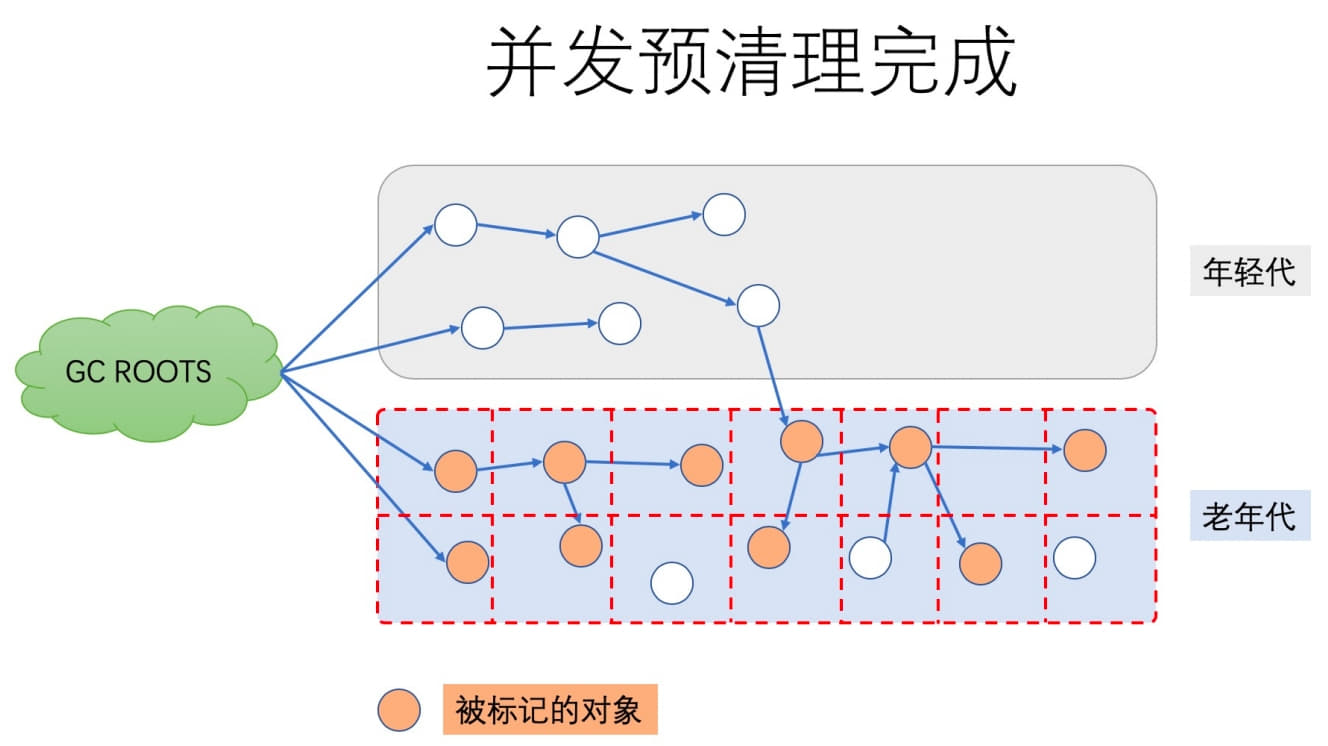
The CMS collection cycle in detail
CMS is often summarized as a low-pause concurrent collector, but its internals are more nuanced. Since it does not compact during normal collection, fragmentation becomes possible. And because the application continues running during most of the cycle, object references can change while marking is in progress. CMS manages these trade-offs through several phases.
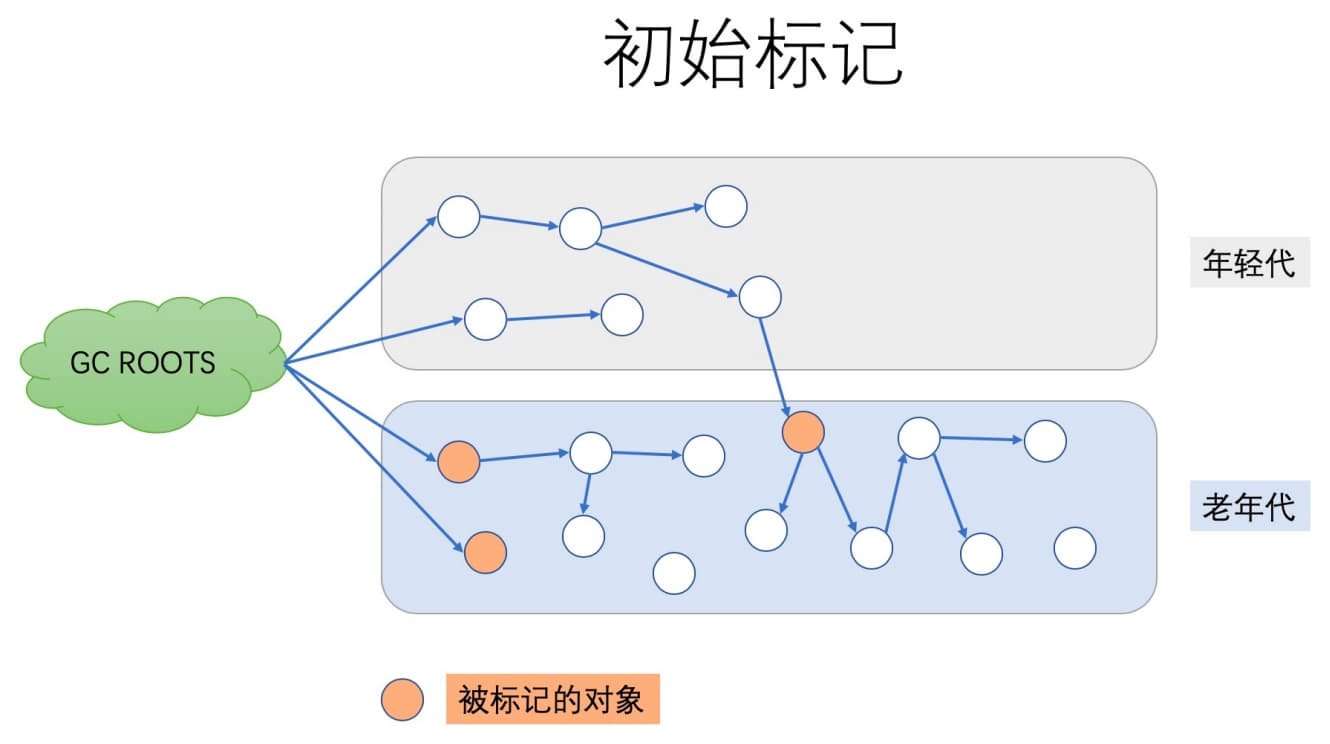
Phase 1: Initial Mark (initial mark) — STW
This phase pauses the world.
Its job is to mark all GC roots, the objects directly reachable from those roots, and objects in the old generation referenced by all live objects in the young generation, since the old generation is being collected separately.
This is conceptually similar to handling cross-generation references in young-generation GC, except the direction is reversed: objects in the young generation that point into the old generation must be considered part of the root set.
Phase 2: Concurrent Mark
In this phase, CMS traverses the old generation starting from the roots identified in the initial mark and marks live objects.
This phase is concurrent with the application, so there is no STW pause here. But not all live objects can be marked perfectly in one pass, because object reference relationships may continue changing while marking is in progress.
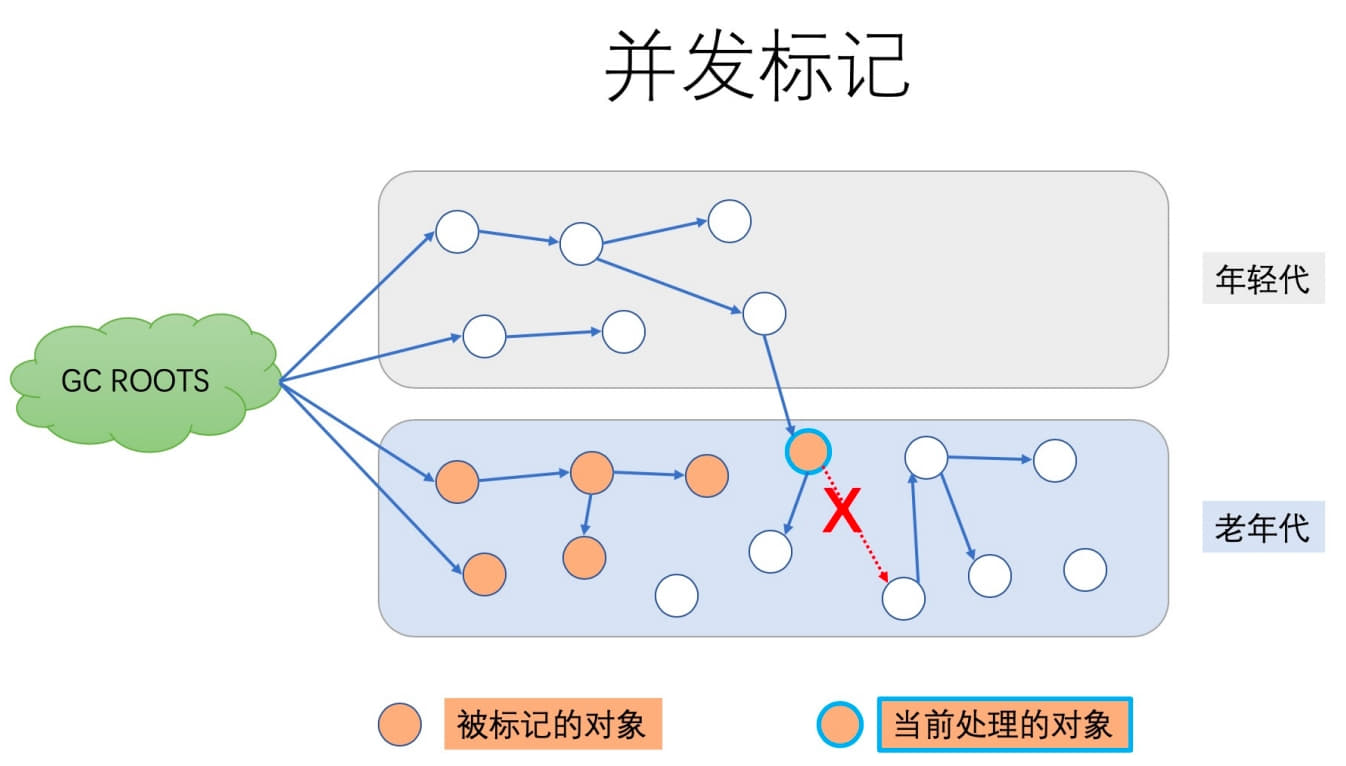
If the application changes references while CMS is traversing the object graph, those changes must be tracked. CMS does that through dirty cards.
Phase 3: Concurrent Preclean
This phase is also concurrent.
While concurrent marking runs, some object reference relationships may change. The JVM uses card marking to identify regions where changes occurred, marking those cards as dirty. CMS then revisits those dirty areas in the preclean phase and marks any objects that should remain live because of updated references.
This phase also processes objects that were newly promoted into the old generation during concurrent marking.
The dirty cards used here are related to, but not identical to, the dirty-card mechanism discussed for young-generation collection. In young-generation GC, dirty cards help avoid scanning the entire old generation by tracking old-to-young references. In CMS, dirty cards record reference changes that happen during concurrent marking and need special handling later.
Both mechanisms rely on HotSpot’s card marking technology, but they are used for different purposes.
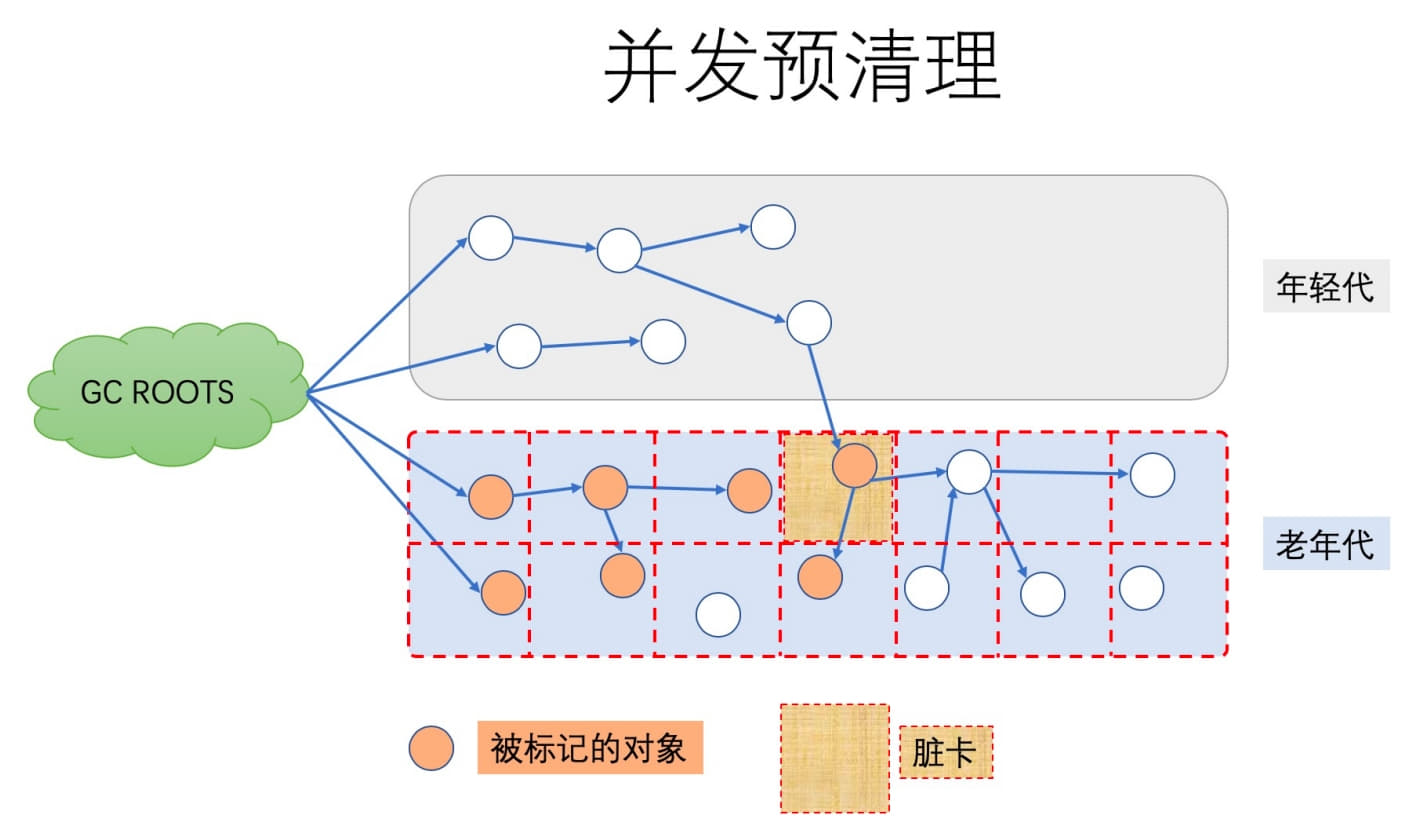
During preclean, these dirty objects are identified and the objects they reference are marked. The cards used for marking are then cleared.
This stage also performs a number of internal housekeeping tasks to prepare for the final remark.
Phase 4: Concurrent Abortable Preclean
This phase is also non-STW.
Its purpose is to do as much additional cleanup work as possible before the final remark. It can have a significant effect on how long the later STW pause lasts.
Phase 5: Final Remark (Final Remark) — STW
This is the second and last STW pause of the CMS cycle.
The goal is to complete marking for all live objects in the old generation. Since the earlier phases were concurrent, the GC threads may not have kept up with all application updates. A short stop-the-world pause is still required to resolve the remaining tricky cases correctly.
CMS usually tries to perform final remark when the young generation is relatively empty so it can avoid triggering multiple STW events too close together.
Once this phase finishes, all live objects in the old generation have been marked.
Phase 6: Concurrent Sweep
No STW pause here.
The JVM reclaims memory occupied by objects determined to be dead.
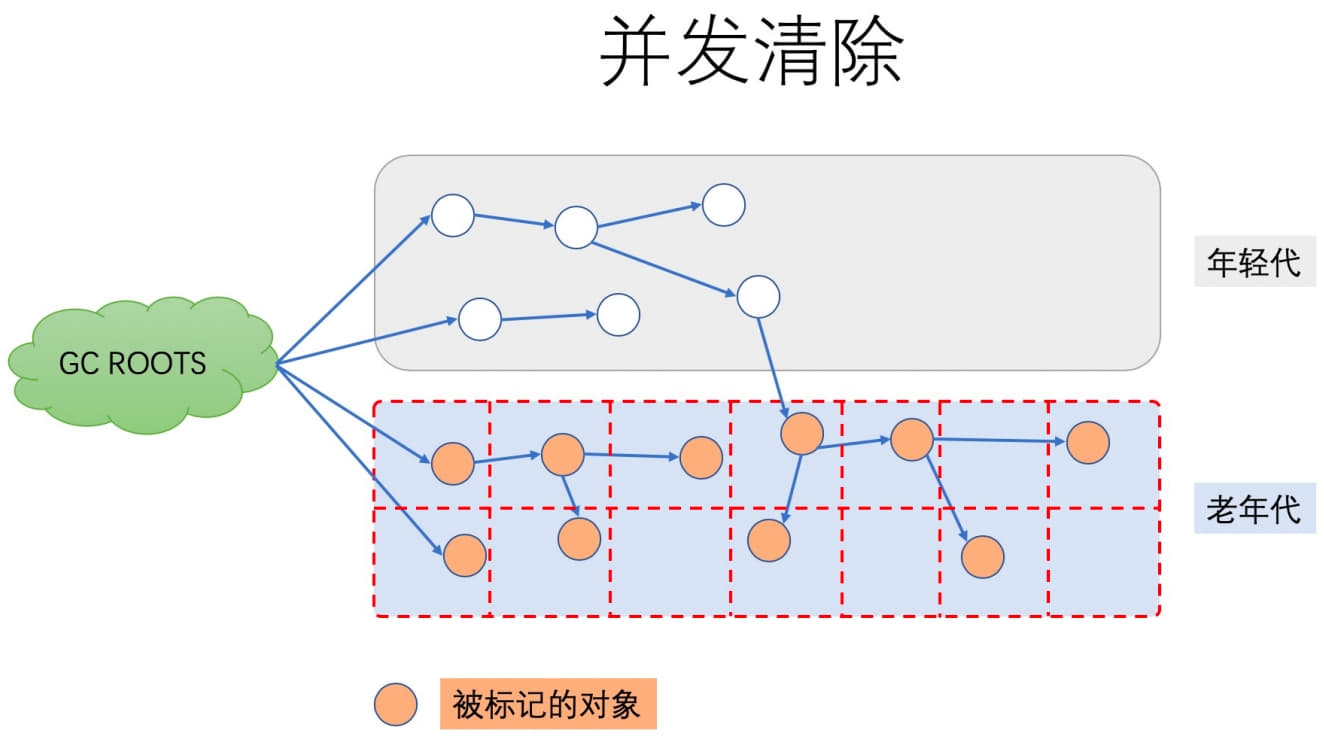
Phase 7: Concurrent Reset
This final phase also runs concurrently with the application. CMS resets its internal state and prepares for the next GC cycle.
Why some descriptions of CMS only show four phases
Many books reduce CMS to four or five steps:
- Initial Mark — mark objects directly reachable from GC roots. (STW)
- Concurrent Mark — traverse the object graph from the initial roots.
- Remark — correct markings affected by concurrent application execution. (STW)
- Concurrent Sweep — reclaim dead objects.
- (Optional mention of Concurrent Reset)
That summary is not wrong. It simply folds the two concurrent preclean phases and the concurrent reset into broader categories because those steps are mainly support work rather than the core act of marking or reclaiming. So the seven-phase and four-phase descriptions are really describing the same collector at different levels of detail.
The key point is that CMS still uses STW—it just keeps those pauses comparatively short and does most of its work concurrently.
CMS drawbacks
CMS was an important step forward, and its strengths are obvious: concurrent collection and low pause time. In some documentation it is even described as a “concurrent low-pause collector.” But it also has clear weaknesses.
1. It is sensitive to CPU resources
Concurrent collectors always compete with the application. CMS is no exception. If CPU resources are limited, the application and GC threads can interfere with each other enough to reduce overall throughput.
2. It cannot fully handle floating garbage
CMS can produce floating garbage: objects that become garbage after the marking phase has already passed them. Because the application continues running, new garbage can be created while CMS is marking and sweeping. That garbage cannot be reclaimed until the next cycle.
This is why CMS cannot wait until the old generation is completely full before starting a cycle. It must leave some headroom for garbage generated during concurrent work. If floating garbage consumes that reserved space before CMS finishes, a Concurrent Mode Failure may occur, which forces a fallback full GC with a long STW pause, typically handled by Serial Old.
3. It causes memory fragmentation
CMS uses mark-sweep, not compaction, for the old generation. Fragmentation is therefore unavoidable. Too much fragmentation can make large-object allocation fail even when total free space is technically sufficient, leading to a costly Full GC just to compact memory.
CMS once provided JVM parameters to mitigate this, but they were deprecated starting in JDK 9.
G1: a milestone in JVM GC design
Garbage First, or G1, marked a major shift in collector design. It introduced two ideas that changed the way HotSpot approached collection:
- collection by local regions rather than treating generations as monolithic memory areas;
- a region-based heap layout.
G1 was designed for server-side applications and was originally intended to replace CMS. By JDK 9, it had replaced Parallel as the default collector.
So what made G1 feel like a real successor rather than just another variation?
G1’s core ideas
CMS struggled with floating garbage and memory fragmentation. G1 still has to deal with those realities, but it approaches them differently.
Floating garbage: beat it with collection speed
Any collector that runs concurrently with the application faces floating garbage. The underlying tension is simple: the GC is collecting while the application is still allocating and generating more garbage.
This cannot be eliminated in principle. What matters is the balance:
- if garbage creation rate > garbage collection rate, eventually even a large heap will be overwhelmed and a Full GC becomes unavoidable;
- if garbage collection rate > garbage creation rate, floating garbage remains manageable.
That is G1’s practical answer. It does not try to “solve” floating garbage directly. It tries to keep collection efficient enough that allocation pressure does not outrun reclamation.
Fragmentation: break the heap into regions
G1 handles fragmentation with a completely different layout strategy.
Instead of treating the heap as contiguous young and old spaces, G1 divides it into many small memory regions—commonly around 2048 of them. Each region can hold objects, and each region may currently act as Eden, Survivor, or Old. All Eden regions together form the logical young generation; all Old regions together form the logical old generation.
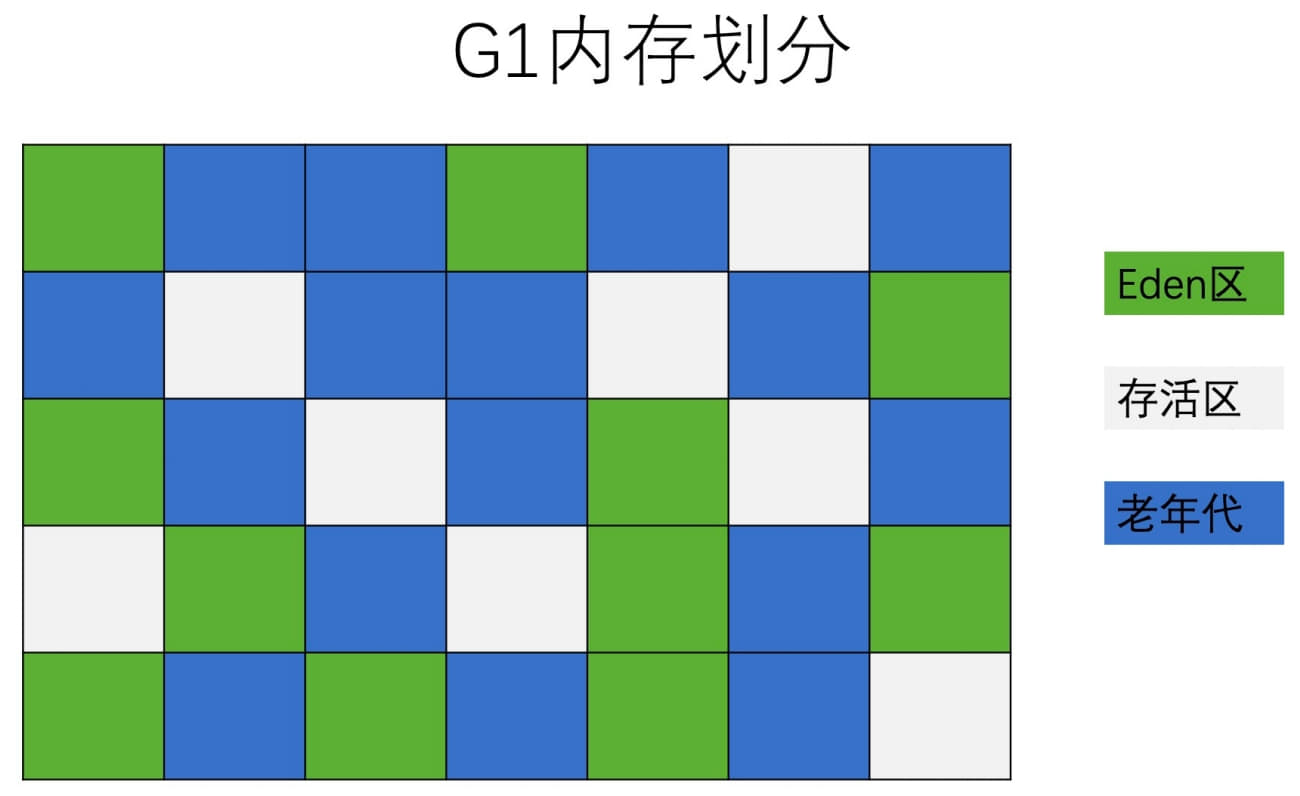
This design makes compaction much more flexible. Instead of trying to compact an entire huge old generation in place, G1 can copy live objects out of selected regions into empty regions, then reclaim whole old regions at once. That avoids long-term fragmentation naturally.
Pause-time prediction
G1 also aimed to support a pause prediction model. The idea is not to promise zero pauses, but to support a target like this:
within a time slice of M milliseconds, garbage collection time should not exceed roughly N milliseconds.
Once heap memory is split into independent regions and collection can focus on subsets of the heap, this idea becomes practical. Each cycle does not need to collect everything. It only needs to collect enough young-generation regions and some high-value old-generation regions so that reclamation rate stays above allocation rate, while trying to keep each pause within the target.
That is why the name Garbage First makes sense. G1 prioritizes the regions expected to produce the most benefit within the pause-time budget.
The hard problems G1 had to solve
The concept is elegant, but turning it into a working collector required solving several difficult engineering problems.
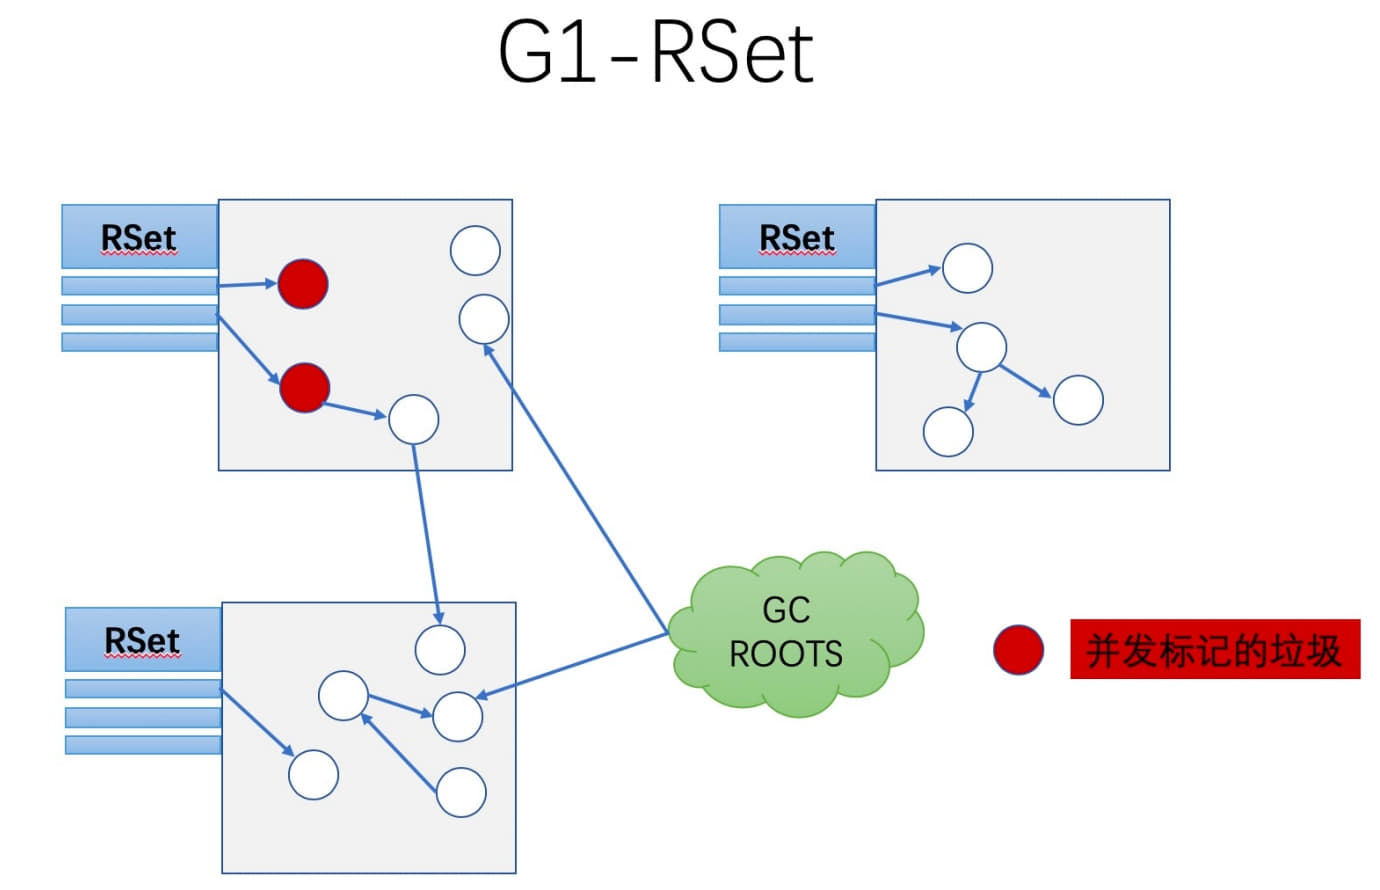
1. Cross-region references
With regions, references no longer just cross generation boundaries; they can cross from any region to any other region. To avoid scanning the entire heap during collection, G1 relies on Remembered Sets.
Earlier collectors already used remembered-set ideas through card tables, but G1’s use is more complex: every region maintains its own remembered set. That set records pointers from other regions into the current region and identifies the cards where those references live.
Conceptually, the structure behaves more like a hash table:
- the key is another region’s starting address;
- the value is a set of card indexes containing references into this region.
A normal card table tends to answer “where do I point?” G1’s remembered set is more about “who points to me?”
This is more expensive to implement and maintain. Combined with the fact that there are far more regions than there were generations in older collectors, it gives G1 a noticeably higher memory overhead. In practice, this extra overhead is often estimated at around 10%–20% of heap capacity.
2. Concurrent marking without interfering with the application
G1 must mark the heap while the application is still changing object references.
One problem is correctness: the object graph must not appear broken to the collector just because references are updated concurrently. The standard solution is tri-color marking.
The other problem is allocation: the application must keep creating objects while marking is ongoing. G1 solves this with two pointers per region called TAMS—Top at Mark Start. They carve out part of the region for new allocations during concurrent marking. Objects allocated above that boundary are treated as implicitly live and excluded from the current marking work.
Like CMS, G1 can still fail if allocation outruns reclamation. If garbage collection speed cannot keep up with memory allocation speed, G1 may be forced into a FullGC, causing a long STW pause.
3. Building a reliable pause prediction model
A user can specify a target pause time using XX:MaxGCPauseMillis, but a target alone is not a solution. G1 needs a way to choose which regions to collect so that it can stay close to the expected pause budget.
Its prediction model is built around a decaying average. During collection, G1 records measurable costs such as:
- time required to collect a given region;
- the number of dirty cards in that region’s remembered set;
- other statistics related to collection cost.
It then derives averages, standard deviations, confidence estimates, and related statistics. The important part of a decaying average is that recent data influences predictions more strongly than older data. In other words, a region’s latest observed behavior matters more than its long-term historical average.
Using those estimates, G1 tries to maximize collection benefit while keeping work within the requested pause-time goal.
The G1 collection cycle
If we ignore write barriers and remembered-set maintenance performed while the application runs, G1’s collection process can be summarized in four major steps.
1. Initial Marking
This marks the objects directly reachable from GC roots and updates the TAMS pointer positions so that user threads can continue allocating safely in usable regions during the next concurrent phase.
This step pauses the world, but the pause is short. In practice, G1 piggybacks this phase onto a Minor GC, so it usually does not introduce a separate additional pause.
In mixed mode, after a Minor GC, if the old generation occupies more than InitiatingHeapOccupancyPercent—45% by default—a Mixed GC cycle is triggered.
2. Concurrent Marking
Starting from GC roots, G1 performs reachability analysis across the heap, recursively traversing the object graph to identify live objects and determine reclaimable candidates.
This phase can be lengthy, but it runs concurrently with the application. Reference changes that happen during this time are tracked so the final marking phase can process SATB-related leftovers correctly.
3. Final Marking
A brief STW pause occurs here to process the remaining SATB work that was left unresolved after concurrent marking.
4. Live Data Counting and Evacuation
This phase updates region statistics, evaluates the cost and value of collecting each region, and selects a collection set based on the requested pause time.
G1 can choose any number of regions for the collection set. It then copies live objects out of those regions into empty regions and reclaims the old regions wholesale.
Because live objects are moved, this phase requires a stop-the-world pause. Multiple GC threads perform the copying in parallel. This pause is known as the Evacuation Pause.
A small note on write barriers: the “write barrier” here is not the same concept as memory barriers in the Java Memory Model. In G1, it is a bytecode-level hook that lets the JVM insert maintenance logic before or after reference writes.
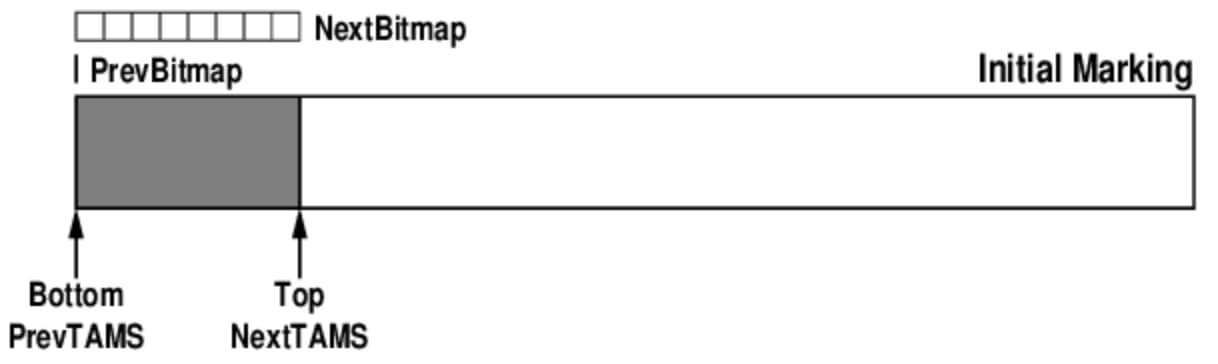
A subtle but important detail: TAMS and concurrent allocation inside one region
One of the trickiest details in G1 is understanding how garbage collection and object allocation can proceed concurrently inside a single region.
The key data structures are:
- two bitmaps:
previousBitMapandnextBitMap; - two
TAMSpointers.
G1 does not directly paint reclaimable objects inside the region itself. Instead, it tracks object liveness through bitmaps.
The two bitmaps
previousBitMapstores the marking result from the previous concurrent marking cycle.nextBitMapstores the marking result for the current concurrent marking cycle.- When current marking finishes, the two bitmaps swap roles.
In the illustration, the white areas represent live objects and the gray areas represent reclaimable garbage.
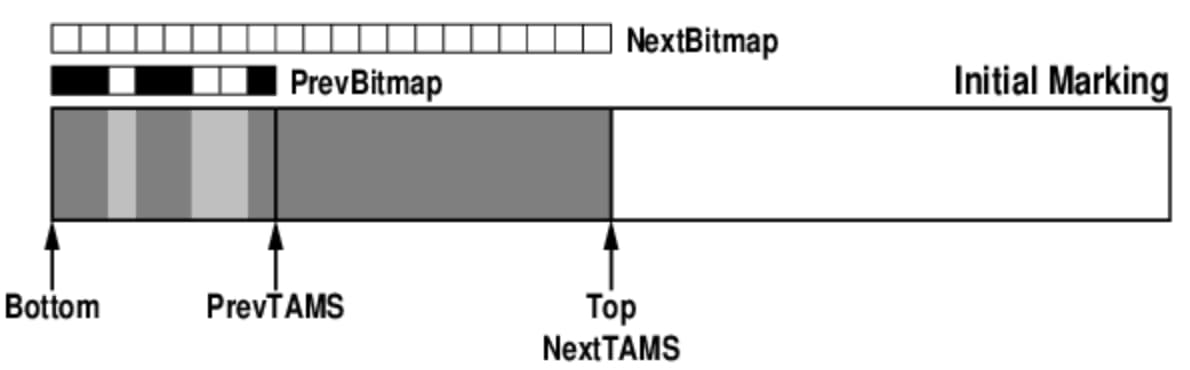
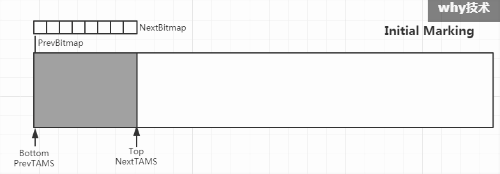
Initial mark state
At the beginning of a cycle:
PrevTAMSis aligned withBottom, the start of the region;NextTAMSis aligned withTop, the boundary between allocated and unallocated memory;NextBitMapis initialized;- because the region is initially clean,
PrevBitMapis empty.
During concurrent marking and final marking
After marking progresses, GC threads mark objects in the range between PrevTAMS and NextTAMS, while new object allocation happens between NextTAMS and TOP.
Objects allocated in that upper part are automatically treated as live for the current cycle. That is how G1 cleanly separates the space under analysis from the space still being used for concurrent allocation.
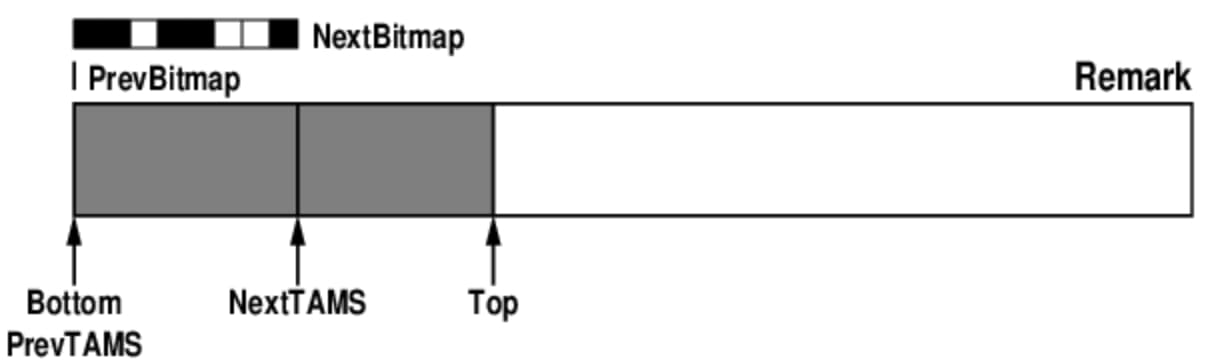
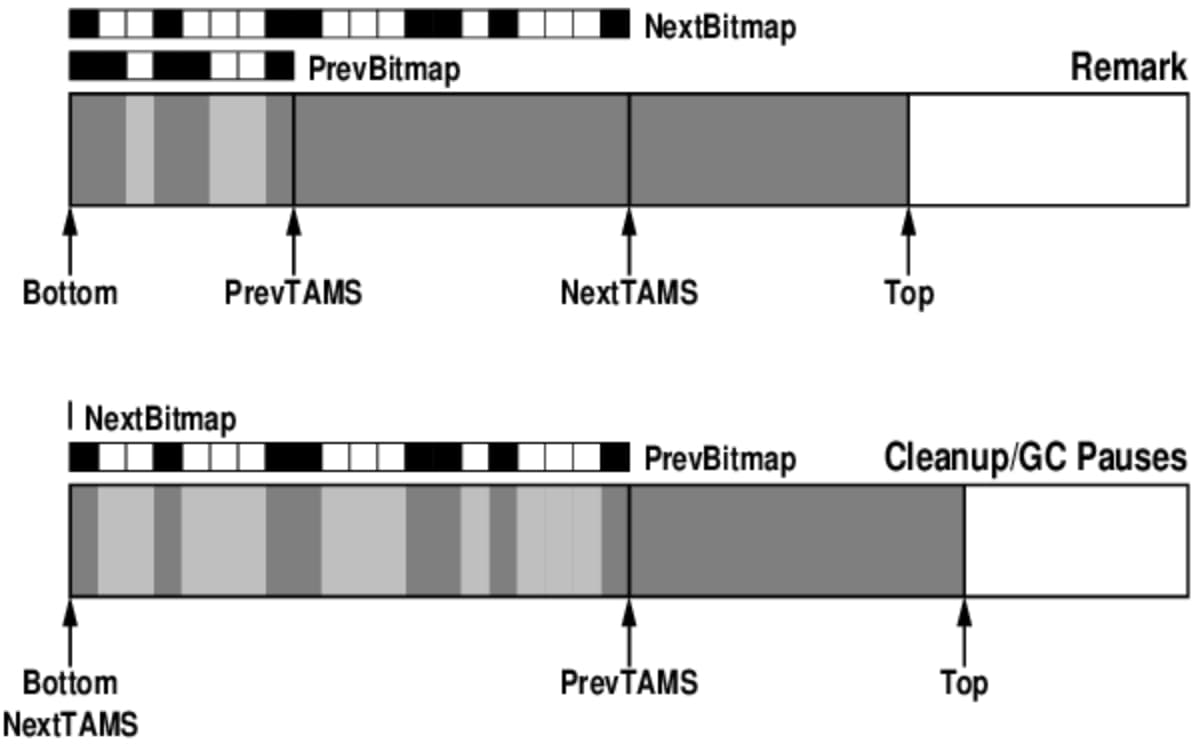
Cleanup behavior
During cleanup, NextBitMap becomes the new PrevBitMap.
If the region can continue to be used without evacuation, garbage may be reclaimed concurrently and the region remains in service. If evacuation is selected, live objects are copied into a new region and the current region is cleared.
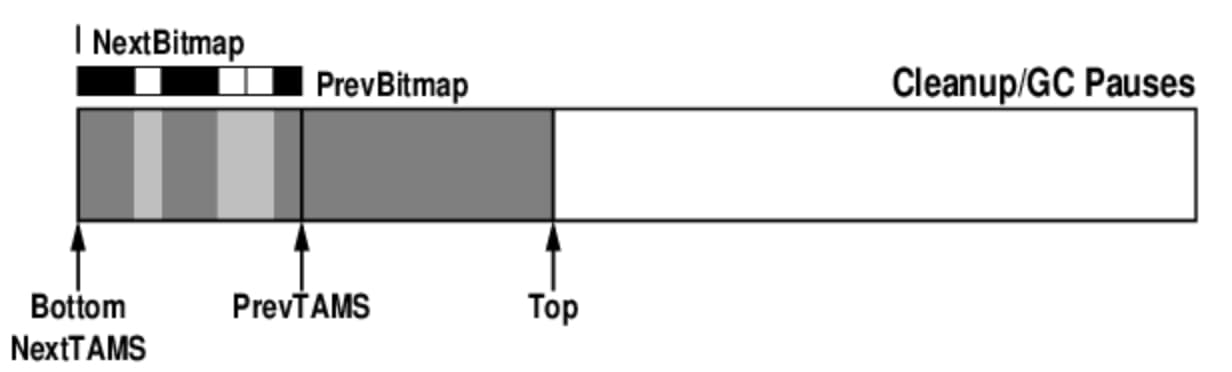
The next initial mark
At the next cycle:
- a fresh
NextBitMapis initialized; NextTAMSis moved toTOP, defining the working range to be marked in the new cycle.
From there, the same TAMS-and-bitmap process repeats.
The overall state inside the region looks like this:
And the dynamic view is even clearer:
This is exactly why G1 needs two TAMS pointers rather than one. A single boundary is not enough to preserve the distinction between the previous mark boundary, the current mark boundary, and the space reserved for fresh allocations while marking proceeds.
Frequently used G1 parameters
Common G1-related options include:
XX:+UseG1GC— enable G1 GC. In JDK 7 and JDK 8, G1 had to be explicitly enabled.XX:G1NewSizePercent— initial young-generation size as a percentage of the Java heap, default 5%.XX:G1MaxNewSizePercent— maximum young-generation size as a percentage of the Java heap, default 60%.XX:G1HeapRegionSize— region size in MB; must be one of 1, 2, 4, 8, 16, or 32. Default is about 1/2000 of the heap. If set larger, large objects may fit directly into a region.XX:ConcGCThreads— number of GC threads running concurrently with the application, default is roughly 1/4 of Java threads. Lowering it may improve internal throughput, but setting it too low can make collection slower.XX:+InitiatingHeapOccupancyPercent(IHOP) — threshold that starts G1’s concurrent cycle, default 45% of the heap. Roughly speaking, once old-generation occupancy reaches this level, concurrent collection begins.XX:G1HeapWastePercent— minimum amount of reclaimable memory needed before continuing collection, default 5% of the heap. G1 does not have to reclaim every last bit of garbage in one round.XX:G1MixedGCCountTarget— target number of mixed GCs after a concurrent cycle, default 8. Since old-region collection tends to take longer than young-region collection, this affects how old-generation work is spread out.XX:+G1PrintRegionLivenessInfo— diagnostic output for per-region liveness information; requiresXX:+UnlockDiagnosticVMOptions.XX:G1ReservePercent— reserve percentage kept available for promotions and other needs, default 10% of heap space.XX:+G1SummarizeRSetStats— print remembered-set summary information when the VM exits; withXX:G1SummaryRSetStatsPeriod, it can also print periodically.XX:+G1TraceConcRefinement— diagnostic logging for concurrent refinement behavior.XX:+GCTimeRatio— controls the ratio of time spent in application threads vs GC threads. The formula remains1/(1+GCTimeRatio). With the default value of 9, up to 10% of time may be spent in GC. This differs from Parallel GC’s default of 99, which corresponds to 1%.XX:+UseStringDeduplication— enables String deduplication, added after JDK 8u20, to reduce duplicated String memory usage.XX:MaxGCPauseMills— desired maximum pause time per GC, default 200 ms. G1 tries to stay near that target.
The most important settings are usually these three:
XX:+UseG1GCXX:+InitiatingHeapOccupancyPercentXX:MaxGCPauseMills
Together they control whether G1 is enabled, when major collection activity starts, and what pause target G1 tries to satisfy.
Choosing a collector in practice
The classic collectors can be summarized like this:
<table> <thead> <tr> <th>Collector</th> <th>Serial / Parallel / Concurrent</th> <th>Young / Old</th> <th>Algorithm</th> <th>Primary goal</th> <th>Typical scenario</th> </tr> </thead> <tbody> <tr> <td>Serial</td> <td>Serial</td> <td>Young</td> <td>Copying</td> <td>Response time first</td> <td>Client mode on single-CPU machines</td> </tr> <tr> <td>Serial Old</td> <td>Serial</td> <td>Old</td> <td>Mark-compact</td> <td>Response time first</td> <td>Client mode on single-CPU machines, CMS fallback</td> </tr> <tr> <td>ParNew</td> <td>Parallel</td> <td>Young</td> <td>Copying</td> <td>Response time first</td> <td>Server mode with CMS on multi-CPU machines</td> </tr> <tr> <td>Parallel Scavenge</td> <td>Parallel</td> <td>Young</td> <td>Copying</td> <td>Throughput first</td> <td>Backend computation with limited interaction</td> </tr> <tr> <td>Parallel Old</td> <td>Parallel</td> <td>Old</td> <td>Mark-compact</td> <td>Throughput first</td> <td>Backend computation with limited interaction</td> </tr> <tr> <td>CMS</td> <td>Concurrent</td> <td>Old</td> <td>Mark-sweep</td> <td>Response time first</td> <td>Latency-sensitive server-side Java applications</td> </tr> <tr> <td>G1</td> <td>Concurrent</td> <td>Both</td> <td>Mark-sweep + copying</td> <td>Response time first</td> <td>Server-side applications, designed to replace CMS</td> </tr> </tbody> </table>Broadly speaking, G1 became the most advanced production-ready collector in classic HotSpot and received the bulk of continued engineering effort. As CMS’s successor, it fixed several of CMS’s weaknesses:
- pause times became more predictable;
- heap fragmentation was effectively eliminated through evacuation and region-based compaction;
- old-generation collection became more incremental and easier to budget.
For systems that are highly sensitive to latency and are not constrained by CPU resources, G1 is usually the best choice in HotSpot.
That said, better latency does not come for free. G1 relies on more write barriers, background threads, remembered sets, and tracking structures, so it generally consumes more CPU and memory than simpler collectors. In smaller heaps where resources are tighter but response time still matters, CMS could be a more practical option.
A rough rule of thumb:
- if throughput is the top priority and CPU should be used as much as possible for business logic, choose ParallelGC;
- if low latency matters most and resources are more limited, choose CMS;
- if the system has a larger heap and you want GC pause behavior to be more controllable, choose G1.
For heap size specifically:
- above 4 GB, G1 often offers better value;
- above 8 GB, G1 is especially worth serious consideration.
Final thoughts
The path from Serial to Parallel, from Parallel to CMS, and from CMS to G1 shows a clear shift in priorities. Early collectors valued simplicity and throughput. CMS brought low-pause collection into real production use, even if it paid for that with CPU sensitivity, floating garbage, and fragmentation. G1 inherited the low-latency ambition but reworked the memory layout and collection strategy enough to become a true milestone.
Understanding CMS deeply also makes G1 easier to understand. Their cycles are not unrelated; G1 builds on many of the same ideas, but pushes them further with regions, remembered sets, evacuation, TAMS, and a pause prediction model.
If CMS feels like an important experiment and G1 feels like the more complete answer, that is probably because the history really did unfold that way.