This setup assumes Prometheus is already installed and running. If you need the same software package used here, it was provided at:
https://pan.baidu.com/s/1QV4KYZksyIp65UsScioq4Q
Extraction code: vcej
The goal is to collect MySQL/MariaDB metrics from a remote host through mysqld_exporter, then have Prometheus scrape those metrics.
Environment
<table> <thead> <tr> <th>Server</th> <th>IP Address</th> </tr> </thead> <tbody> <tr> <td>Prometheus server</td> <td>192.168.116.129</td> </tr> <tr> <td>Monitored server (MySQL)</td> <td>192.168.116.130</td> </tr> <tr> <td>Grafana server</td> <td>192.168.116.131</td> </tr> </tbody> </table>1. Install mysqld_exporter on the monitored MySQL server
Download mysqld_exporter from the Prometheus downloads page:
https://prometheus.io/download/
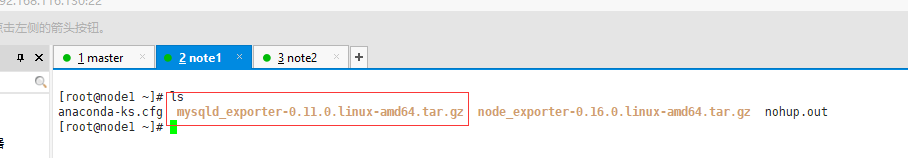
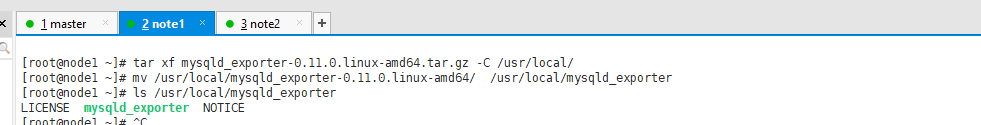
Upload the package to the MySQL server, then extract and place it under /usr/local/:
1 2 3</th>
<th>tar xf mysqld_exporter-0.11.0.linux-amd64.tar.gz -C /usr/local/ mv /usr/local/mysqld_exporter-0.11.0.linux-amd64/ /usr/local/mysqld_exporter ls /usr/local/mysqld_exporter</th>
</tr>
</thead>
<tbody>
<tr>
<td></td>
<td></td>
</tr>
</tbody>
</table>
2. Install MariaDB and create a monitoring account
Install MariaDB on the monitored machine, start it, enable it at boot, and enter the MySQL shell:
<table> <thead> <tr> <th>1 2 3 4</th>
<th>yum install mariadb\* -y systemctl restart mariadb systemctl enable mariadb mysql</th>
</tr>
</thead>
<tbody>
<tr>
<td></td>
<td></td>
</tr>
</tbody>
</table>
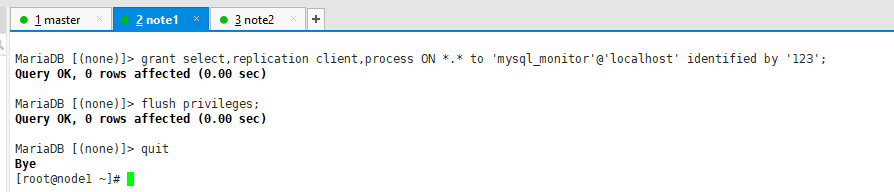
Grant the permissions needed by the exporter:
<table> <thead> <tr> <th>1</th>
<th>MariaDB [(none)]> grant select,replication client,process ON *.* to 'mysql_monitor'@'localhost' identified by '123';</th>
</tr>
</thead>
<tbody>
<tr>
<td></td>
<td></td>
</tr>
</tbody>
</table>
A key detail here is that the authorization host is localhost, not the Prometheus server IP. Prometheus does not connect directly to MariaDB to read metrics. Instead, Prometheus scrapes mysqld_exporter, and mysqld_exporter connects locally to MariaDB.
Then apply the privileges and exit:
<table> <thead> <tr> <th>1 2</th>
<th>MariaDB [(none)]> flush privileges; MariaDB [(none)]> quit</th>
</tr>
</thead>
<tbody>
<tr>
<td></td>
<td></td>
</tr>
</tbody>
</table>
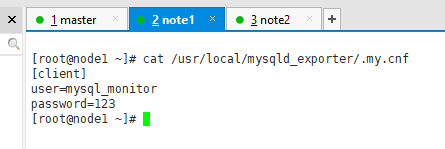
3. Configure the exporter credentials
Create a MariaDB client configuration file for mysqld_exporter, and make sure the username and password match the account you just granted:
1</th>
<th>vim /usr/local/mysqld_exporter/.my.cnf</th>
</tr>
</thead>
<tbody>
<tr>
<td></td>
<td></td>
</tr>
</tbody>
</table>
<table>
<thead>
<tr>
<th>1 2 3</th>
<th>[client] user=mysql_monitor password=123</th>
</tr>
</thead>
<tbody>
<tr>
<td></td>
<td></td>
</tr>
</tbody>
</table>
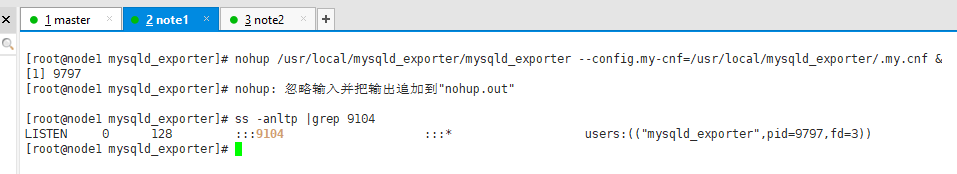
4. Start mysqld_exporter
Launch the exporter with the configuration file:
<table> <thead> <tr> <th>1</th>
<th>nohup /usr/local/mysqld_exporter/mysqld_exporter --config.my-cnf=/usr/local/mysqld_exporter/.my.cnf &</th>
</tr>
</thead>
<tbody>
<tr>
<td></td>
<td></td>
</tr>
</tbody>
</table>
After startup, confirm that it is listening on port 9104.
5. Add the MySQL target in Prometheus
Go back to the Prometheus server and edit the main configuration file:
<table> <thead> <tr> <th>1</th>
<th>vim /usr/local/prometheus/prometheus.yml</th>
</tr>
</thead>
<tbody>
<tr>
<td></td>
<td></td>
</tr>
</tbody>
</table>
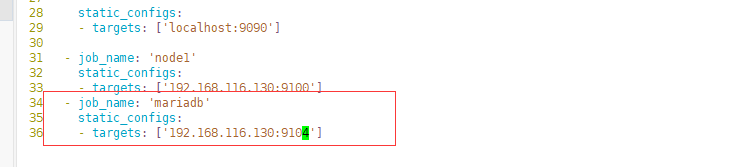
Add a scrape job for the MariaDB exporter at the end of the file:
<table> <thead> <tr> <th>1 2 3</th>
<th>- job_name: 'mariadb' static_configs: - targets: ['192.168.116.130:9104']</th>
</tr>
</thead>
<tbody>
<tr>
<td></td>
<td></td>
</tr>
</tbody>
</table>
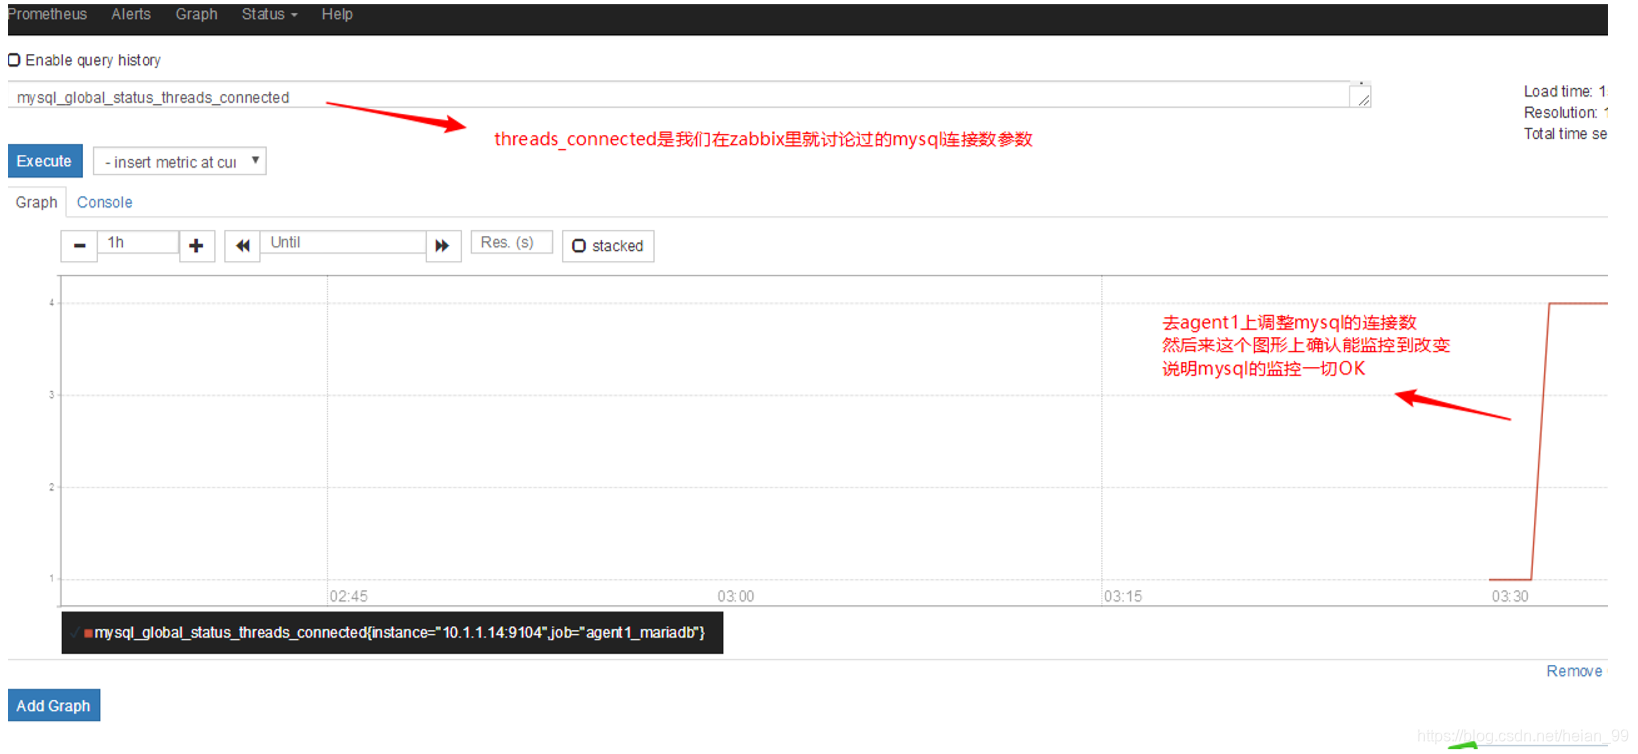
You can also use a more descriptive job name, as in this example:
<table> <thead> <tr> <th>1 2 3 4</th>
<th>- job_name: 'agent1_mariadb' # 取一个job 名称来代表被监控的mariadb static_configs: - targets: ['10.1.1.14:9104'] # 这里改成 被监控机器的IP,后面端口接9104</th>
</tr>
</thead>
<tbody>
<tr>
<td></td>
<td></td>
</tr>
</tbody>
</table>
Replace the target IP with the actual address of the monitored server, and keep port 9104.
6. Restart Prometheus
After modifying the configuration, restart the Prometheus process:
<table> <thead> <tr> <th>1</th>
<th>pkill prometheus</th>
</tr>
</thead>
<tbody>
<tr>
<td></td>
<td></td>
</tr>
</tbody>
</table>
<table>
<thead>
<tr>
<th>1</th>
<th>/usr/local/prometheus/prometheus --config.file="/usr/local/prometheus/prometheus.yml" &</th>
</tr>
</thead>
<tbody>
<tr>
<td></td>
<td></td>
</tr>
</tbody>
</table>
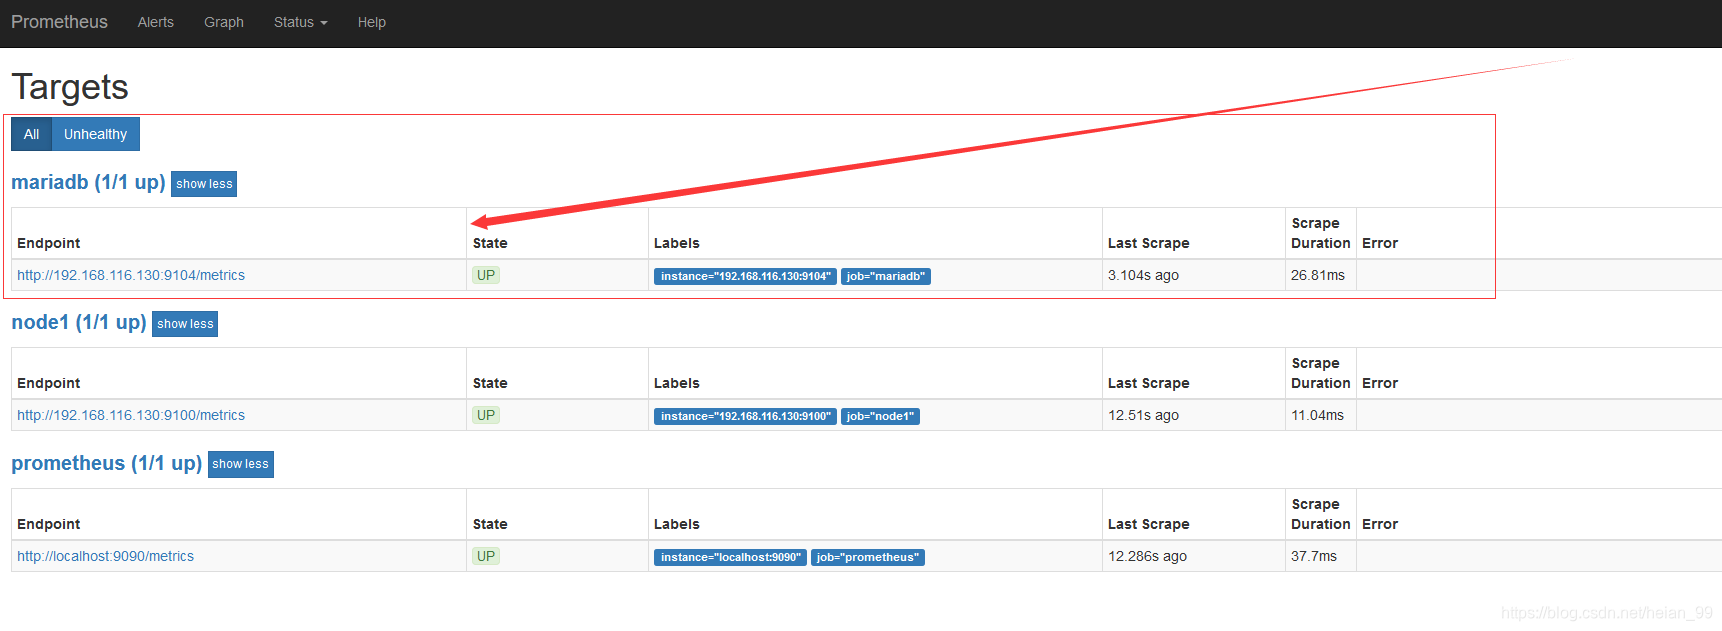
7. Verify the target in the web interface
Open the Prometheus web UI, then go to Status -> Targets. If everything is configured correctly, the MariaDB target will appear there and should be shown as being monitored successfully.